Wednesday, August 20, 2008

Fannie Freddie Looking Ugly - Real Ugly

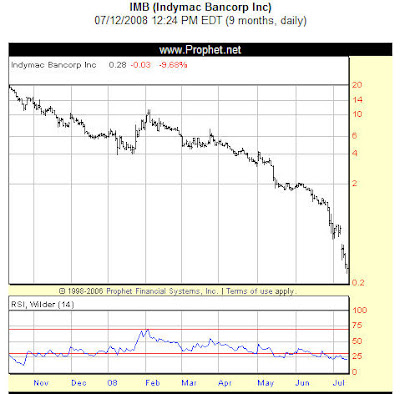
Not to be an alarmist, but the stocks charts of both Fannie Mae (FNM) and Freddie Mac (FRE) look to be in what I call a "death spiral", which is a stock march to either extinction or a long time-out under $5. We've seen it with other bank stocks, Indymac, National City, WAMU. In indymac's case, they went out of business. For WAMU and National City, amongst others, they're hanging on for dear life.


Now, I call it a "death spiral", but it doesn't necessarily mean that the company goes out of business; it could mean that the company bumps along the bottom for a protracted period of time recapitalizing itself. Either way, it's ugly, and either way, we need to begin to visualize the mortgage world with either a greatly reconfigured Fannie Mae and Freddie Mac, or without either of those two companies.

The key to Fannie and Freddie's survival is how long it takes for the default/foreclosure rates to bottom. Once the market gets some clarity regarding that issue, then you'll begin to see capital begin to move back into the mortgage markets.

The ARM resets peaked this summer, and they will essentially fall off the table after December 2008. From January 2009 moving forward, the credit markets should begin to see the shape of the mortgage default/foreclosure situation, in essence how deep the water is. The question for Fannie and Freddie is whether they can survive to that point recognition in the credit markets.

My guess is that in the end, Freddie Mac folds it's tent, and Fannie gets saved, but shareholder equity gets massively diluted.

Friday, August 15, 2008

Banks Already Bankrupt?

Are the banks already bankrupt? That is the money-shot in an interview with Marc Faber:


http://www.creditwritedowns.com/2008/06/marc-faber-says-avoid-financials-and.html


Q: On the financial sector, part of the reason why we saw the sell-down in the US overnight was because of a downgrade for some of the brokers there. There are still lingering concerns about the impact on the financials, not just in the US but Europe as well. You expect about 150 bank failures in the next 12 months. Can you explain this?


A: A lot of banks are already bankrupt. A lot of monoline insurance companies are bankrupt and financial institutions hide their rotten assets in level three asset categories where you don’t really need to value them. But, if you have stock prices like the monoline insurance Ambac and MBIA dropped 95% and then some rating agencies until last week were still carrying a AAA rating. It is a total joke.These companies are basically out of business. So, the financial sector by and large has much larger problems than is perceived by the investment community. The stock market to some extent is telling you that. It is giving you the price, market signals. It is quite funny that one financial firm downgrades another financial firm and another financial firm begins to downgrade a financial firm that was downgrading themselves. It is kind of a domino effect. It is actually quite amusing to watch it all.


This leads to a discussion of what are called Level 3 Assets.

Here's a good discussion of Level 3 Assets:

http://www.themoneyblogs.com/urbandigs/my.blog/level-3-assets-credits-next-concern.html


Level 3 Assets: Credit's Next Concern
Posted on 11/04/2007 06:26:00

A: I want to discuss what will soon be in the media alot, as round 2 of the credit crunch already is underway! First off, I don't care what CEO's get fired or how many rate cuts printing press Ben Bernanke does, the credit crisis problems lie so deep that these actions will not cure the disease; it will only provide some temporary relief as the problem phases itself out. What we need to look out for now, is what round 3 of the credit crunch may be caused by. I think it will be lowered valuations for Level 3 Assets. On November 15th, a new accounting rule will require the disclosure of these assets whose market valuations were assigned by in-house models, as the market where they trade in are illiquid and in distress.


LEVEL 3 ASSETS (via Marketwatch.com) -

Level 3 assets are those that trade so infrequently that there is virtually no reliable market price for them, and valuations for these assets are based on management assumptions.


Problems people! I've discussed many times in the past few months how the markets for these CDO's, CMO's, and other mortgage backed securities have seized up. There are just no bids and no volume, making no market!


Now, what we do know is that brokerages, banks, hedge funds, and other institutions are holding very complicated assets whose actual value has virtually vanished. The key word here is actual, or real market value. But these level 3 assets are NOT being marketed to the real market! They are being held, hidden on the books of major corporations and institutions, as management places their best-guess valuations that are almost always grossly overvalued!


Round 3 of the credit crunch will be the 'coming out' of sorts of the adjusted valuations of these level 3 assets leading to the uncovering of major losses to the most exposed corporations and institutions. I think this process will take months to play out and we are heading right into the heart of storm as November 15th approaches.

______________________________________


Ok, so now we've got an idea of what Level 3 Assets are (the toxic mortgage paper that nobody wants), now let's see who's holding the most of this stuff.


As a percentage of equity, Freddie Mac holds the top spot. Not good.

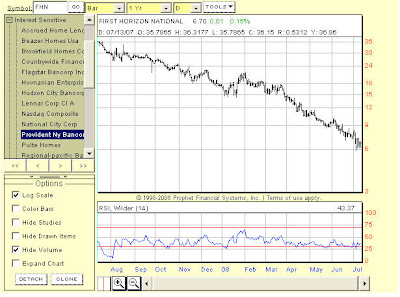
If you're wondering why Indymac went out of business, take a look at the top of the two charts above. If you're wondering why it's going to take a government bailoout to prevent Freddie Mac from going out of business, take a look at the two charts above.

Wednesday, August 6, 2008

Recent Gyrations

Stock Market - Nasdaq

It's time for me to fess up. When I was much younger, I used to do a great deal of stock trading. I was very much into technical analysis and cut my teeth on Elliot Wave Theory. I saw Bob Prechter on Wall Street Week, as he had nailed gold prices back in the early 80's, and I was hooked. The truth is, as I've matured, I've veered away from Elliot Wave as a primary tool for analyzing markets. Imo, EWT is too limited, and frankly there are always multiple interpretations. Again, imo, the practioners of EWT are always perfect in hindsight, but there have been too many major miscalls along the way (Dow 3686 as THE major market top, for example) for me to look at EWT as a primary analysis tool. It simply hasn't been reliable enough, and frankly, it's too simplistic.

Having said all that, I suppose due to my early training, when I look at a stock chart, especially an index chart, I see it through the eyes of Elliot. 5 Wave as a basic impulse, 3 Waves as a counter-trend wave.

I mention this because as I look at the Nasdaq chart, it seems to be pretty clear.


From October 30, 2007 to March 17,2008 the Nasdaq was in an initial primary leg down.

10/30/07 High: 2828.32
03/17/08 Low: 2,155.42

Total decline: 673.4 point or 23.81% decline from the high, 31.24% decline measuring the 3/17 low as the denominator.

Counter-trend rally targets:
Math for calculating targets:

I'll create one example for the 61.8% target, you have to walk through the rest of the math on your own, or trust my numbers.

673.4 (Nasdaq Point Decline) / 2155.42 (Nasdaq Low) = 31.24%
31.24% * 61.8% = 19.30766% * 2155.42 = 416.16 points (Counter-trend Point Target)
2155.42 Wave 1 Low + 416.16 (Counter-trend Point Target) = 2571.58 Target

61.8%: 2571.58
50%: 2492.10
38.2%: 2412.64

The counter-trend rally appears to have ended on 06/05/08 at 2549.99. Based on the wave structure, and that we came very close to hitting the 61.8% Counter-Trend price targets, I've concluded that a Wave 2 counter-trend rally ended on 06/05/2008. The significance of this is that Elliot Theory states that Wave 3, which we have entered into if I am correct, is typically the most brutal, violent leg down.

Subdividing Wave 3:

Wave i :

06/05/08: 2549.92 High
07/15/08: 2167.29 Low

Points: 382.63
Short Term Chart:
Wave ii: (we are currently in counter-trend wave ii up)


So we are in what is called a complex wave ii, what's called a triple correction. The key point is that it appears that the market is very close to the end of this correction, so we should know very soon, whether I've got the big picture correct. And the big picture is for another major market decline, with the lows of March 17 at 2155.42 on the Nasdaq to be significantly broken.
Technicals Meshing With Fundamentals
I mention all this because there have been a number of stories about Freddie Mac today, it's potential insolvency, and speculation about how much more pain we have in the housing market. It's a situation where the fundamentals in the economy fit with the technical picture painted by the Elliot Wave analysis. Consistent with this theme, is the story from Morgan Stanley, freezing Helocs.
Morgan Stanley Said to Freeze Home-Equity Credit Withdrawals

Home Prices Could Plunge Another 20%: Freddie CEO
Banks Lead Decline After Freddie Results
Freddie Mac
FREDDIE MAC
FRE
7.14 -0.90 -11.19%

lost $1.63 a share, about three times as big as the loss of 53 cents a share analysts had predicted. The company said it's doubling its provisions for loan losses to $2.5 billion since the end of the first quarter and that it will slash its dividend by as much as 80 percent.


Wednesday, July 30, 2008

Recent Columns Of Interest

First off, there's a terrific column called:"I Said What?" - a look back at nine regrettable comments by bank chief executive officers.

At #1: John Thain, CEO of Merrill Lynch

"We're very confident that we have the capital base now that we need to go forward in 2008." January 18, 2008.
"...Today I can say that we will not need additional funds. These problems are behind us. We will not return to the market." March 8, 2008
"We have more capital than we need, so we can say to the market that we don't need more injections. We can confirm that we have tackled the problem." March 16, 2008
John Thain learned the hard way that saying the same thing over and over won't necessarily make it come true. The truth is, Merrill was far from finished tapping the markets. Earlier this month, it raised $8 billion by selling stakes in Bloomberg and Financial Data Services. And on Monday it announced plans to sell $8.5 billion of new shares.

See the rest here

Next up, an outstanding column by a trader I have a huge amount of respect for, Todd Harrison. Todd is a very smart guy, well connected in the finance community, and amongst other things, the founder of the financial blog Minyanville.

His column at MarketWatch is very insightful. He writes about the potential consequences of eliminating the practice of shorting stocks, specifically financial stocks, and how eliminating these shorts also eliminates a layer of demand to purchase stocks in a downturn.


TODD HARRISON
Hanky panky
Commentary: Are we trading against Hank Paulson?
By Todd Harrison
Last update: 12:01 a.m. EDT July 30, 2008

NEW YORK (MarketWatch) -- They say the friction between opinions is where true education lies. If that's true, we've officially entered the realm of higher learning.

As both sides of the societal chasm haggle over how the market -- and, by extension, the economy -- is being handled, Treasury Secretary Hank Paulson has found himself in the center of the storm.

Perhaps that's a fitting role for the former chairman of Goldman Sachs a man who deftly sold his equity holdings tax-free when he took the position in 2006. If anyone knows how the game is played, it's Hammering Hank. When pressed on policy, he recently responded, "I'm playing the hand I've been dealt."

Fair enough and truth be told, there isn't a realistic solution other than the elixir of time and price. It just so happens that we've all got chips on this particular table as he draws his next card.

Sucker's bet
We can wag our finger that the writing was on the wall since the subprime simmer of last summer. See MarketWatch column.

We can point to Alan Greenspan, who sowed the seeds of cumulative imbalances during the Asian contagion and tilled them anew after the technology bubble burst. See MarketWatch column.

Wall Street, repackaging risk and masking the disease with years of financial engineering, deserves a dishonorable mention as we dissect the discussion. See MarketWatch column.

Wednesday, July 16, 2008

Mortgage Spreads Rising


With greater risk coming from high foreclosure/default rates as we progress through this cycle, spreads between mortgages and treasury securities continue to widen.


Sunday, July 13, 2008

Pictures Worth A Thousand Words

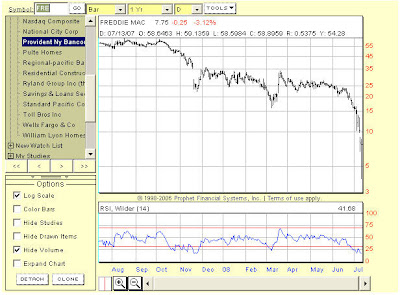
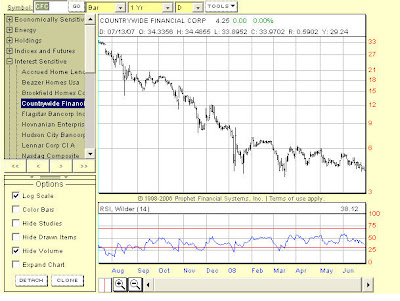
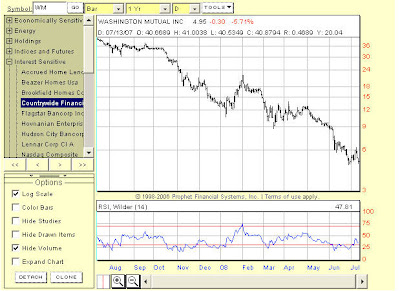
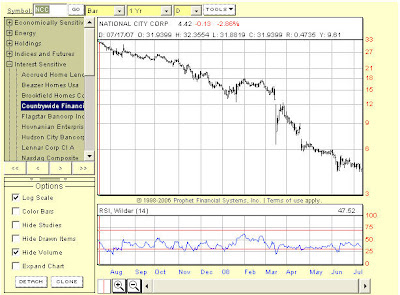
Here are a few stock charts of various mortgage lenders.
Not identical charts, but reasonably similar.

Fannie Mae


Freddie Mac


Countrywide


Washington Mutual


National City

First Horizon

Indymac


Saturday, July 12, 2008

Indymac Bank R.I.P.


From Saturday, June 28 Mortgage Strategery Entry:
"I could see at least a half dozen major wholesale mortgage lenders close their doors in the next six months. I'm not naming names at this point, but I've got several lenders on my major distress list."

Yes, Indymac Bank was on the list.

Honestly, IMB was the most obvious name on the list, but they're one of our lenders, so out of courtesy, I don't want to name specific lender names in public. I simply steer away from them and don't send them any loans unless I absolutely have to, because there's nothing worse than having a loan with a lender that is going out of business. You've got to re-submit with a new lender, if it's a purchase transaction, you lose a great deal of time, and it's frustrating for everyone involved.

Ok, so how do I come up with my distress list. Pretty easy actually. Two steps: 1) Banks that are still in business that used to do a lot of Alt-A and Option Arm business, 2) Look at the stock price, has it nose-dived and is not pulling out of the nose-dive?

Also, Indymac Bank pulled out of the construction lending business back in January.

I knew there was a big problem at IMB because we had an extremely strong construction loan (very strong borrower) with IMB back in December '07, and IMB Construction Underwriting kept coming up with really lame issues regarding the loan: huge cut to LTV because the property was 20.1 acres and not 20 acres, they cut the appraisal value by $40,000 when the appraisal was based on cost basis because comps were too far apart (just as an fyi, in some parts of the country there aren't many comparable sales in the area, especially when the closest neighbor is 10 miles away). When lenders start doing stuff like Indymac was pulling, I take it as a cue that something is wrong with the company because they are giving us reasons not to do the loan with them, basically begging us to pull the loan. Which I did.
Sure enough, about two weeks later (in January of '08), Indymac announced that they were exiting the construction lending business.

There are other lenders that I'm pretty certain will meet the same fate as IMB.

Saturday, July 12, 2008:
http://www.bizjournals.com/atlanta/stories/2008/07/07/daily91.html
Feds shuts down IndyMac Bank, two ATL centers impacted

Federal regulators closed Pasadena, Calif.-based Indymac Bank late Friday -- the shuttering of the largest bank nationwide since the Savings & Loan Crisis in 1991, and a move that will affect two Atlanta operations centers.
The closure also marks the second-largest closure of a bank since 1934, according to the
Federal Deposit Insurance Corp.

In a unique twist, IndyMac Bank's closure is blamed, in part, by the public disclosure of a letter by U.S. Sen. Charles Schumer (D-N.Y.), expressing concern about the bank's ability to operate going forward.
The bank had $32 billion in assets and $19 billion in deposits, according to the
Office of Thrift Supervision and FDIC.

At the time of closing, the bank had roughly $1 billion in uninsured deposits.

The FDIC announced the roughly 10,000 customers with uninsured deposits will receive their deposit amounts.

The FDIC also said it expects the fund to pay between $4 and $8 billion out of its deposit insurance fund, which backstops all U.S. bank deposits to a certain dollar level, in part to stave off a deposit run on banks.

At the start of the 2008, the FDIC insurance fund had $52.2 billion in assets.

Indymac Bank is the largest U.S. bank failure since Jan. 6, 1991, when the Bank of New England, with $22 billion in assets, failed.

Regulators are preparing the institution for future sale, and the FDIC was named conservator of the bank's assets, meaning the collapse of the bank happened so quickly FDIC did not have time to arrange a sale of the bank's assets before closing it.

In a statement, the OTS said:
"The immediate cause of the closing was a deposit run that began and continued after the public release of a June 26 letter to the OTS and the FDIC from Senator Charles Schumer of New York. The letter expressed concerns about IndyMac's viability. In the following 11 business days, depositors withdrew more than $1.3 billion from their accounts."

IndyMac Bancorp Inc. and its subsidiary bank, federally chartered thrift IndyMac Bank, operated a large national mortgage business reliant on low documentation mortgage loans, known as Alt-A mortgages.
IndyMac operated two metro Atlanta operations centers, according to its 2007 annual report: A regional mortgage banking center in Norcross, and subsidiary Financial Freedom's Eastern Operations Center in Atlanta.

It is unclear how many employees will be impacted by the closure in metro Atlanta.
The closure comes on the heels of the bank announcing July 7 it was shuttering much of its lending business and cutting 3,400 of its 7,200 employees.