Friday, December 30, 2011

Something To Get Off My Chest: CNBC vs Zerohedge

Not anything mentioned today on CNBC, but there have been plenty of times in the past where I've heard CNBC commentators making snarky comments directed in general at "financial bloggers" but were veiled references at specific ZH blog entries.

To CNBC...I've watched your channel since it's infancy. I watch FNN religiously before you were even conceived. I remember the days of Neil Cavuto and Kathleen Campion...Me and you go way back...

But cut out the snarky comments directed at ZH. ZH does some things much better than CNBC. They cover the sausage making that goes on at the Fed. ZH provides the ugly details that CNBC glosses over or doesn't mention. They cover the European unwind in much better detail that CNBC.

There is a place in the world for both. No need for the snark, we can judge for ourselves.

Posted via email from htlkirkland's posterous

Fannie Mae 3.5% Bond Chart Comment Addition

In the comments section of the bond chart just posted I mentioned: "It looks like the more ambitious objective of 103.91 (from Sep 22 high) is going to be next target, and should get fufilled." I left out that the target should be fufilled sometime between the 2nd or 3rd week of January.

Posted via email from htlkirkland's posterous

Fannie Mae 3.5% Bond Chart

Vegas Baby

At least Vegas gives you pretty girls in skimpy outfits with plenty of free booze to go around. The ES doesn't even give you a kiss.

Posted via email from htlkirkland's posterous

Treasuries at 1.88% - Stocks Remain Near 3 Month Highs

Frankly, I don't think this can last much longer (but I could definitely be wrong), with treasury yields indicating anticipated recessionary levels (although with help from the Fed and currency flight from Europe) and stocks remaining elevated. A big problem with such heavy Fed intervention is that it distorts what the markets are indicating.

Do we listen to the bond market, or the stock market? If you put a gun to my head, I'd say listen to the bond market. Of course, the rational thing to do is probably to simply stay out of the market entirely...sometimes the most profitable trading path is to take a vacation.

Sp_dec_30_2011
Tnx_dec_30_2011

Posted via email from htlkirkland's posterous

Best fan sign of the year: Packers fan uses game tickets to get back at cheating ex

The Packers are the heart and soul of Green Bay. Fans own "stock" in the team, and season tickets are a valuable commodity. That made tickets to the Christmas night game with archrival Chicago either the best gift a fan could find under the tree, or (if her sign is to be believed) a perfect way to get back at a cheating boyfriend.

http://sports.yahoo.com/nfl/blog/shutdown_corner/post/Packers-fan-uses-game-t...

Packers_my_cheating_ex_boyfriend

Posted via email from htlkirkland's posterous

Sunday, December 25, 2011

China's Role In European Bailout vs 2 Months Ago

I would be laughing if it wasn't so tragic...If you're wondering the depths of European desperation, as well as China's, consider the following stories are a mere two months apart. There was no way in hades that China was ever going to step up to the plate for Europe.

Oct 27, 2011:

China could play key role in EU rescue

http://www.ft.com/intl/cms/s/0/7505d210-00ba-11e1-8590-00144feabdc0.html#axzz1hcMBJbzc

December 25, 2011

China Insolvency Wave Begins As Nation's Biggest Provincal Borrowers "Defer" Loan Payments

http://www.zerohedge.com/news/china-insolvency-wave-begins-nations-biggest-provincal-borrowers-defer-loan-payments

Posted via email from htlkirkland's posterous

Monday, December 19, 2011

Doug Short's Four Bad Bears

Four_bad_bears_chart_dec_2_2011

http://www.advisorperspectives.com/dshort/updates/Four-Totally-Bad-Bears.php

This chart series features an overlay of the Four Bad Bears in U.S. history since the market peak in 1929. They are:

  1. The Crash of 1929, which eventually ushered in the Great Depression,
  2. The Oil Embargo of 1973, which was followed by a vicious bout of stagflation,
  3. The 2000 Tech Bubble bust and,
  4. The Financial Crisis following the nominal all-time high in 2007.

The series includes four versions of the overlay: nominal, real (inflation-adjusted), total-return with dividends reinvested, and real total-return.

Posted via email from htlkirkland's posterous

FNMA 3.5% Chart

Sunday, December 18, 2011

CBO’s Budget Infographic

http://cboblog.cbo.gov/?p=3042

The federal government's finances are pretty complicated and not always easy to understand, and most of CBO's reports about the budget outlook are fairly lengthy and detailed. In fact, one of the questions we're most frequently asked is how much the government spends and takes in each year. For those who are not very familiar with the budget, finding the answer is sometimes harder than it should be.

CBO's newest infographic—that is, information presented in a graphic form—describes some key elements of the federal budget, including a breakdown of its major components and a visual history of the budget and federal debt over the past 40 years. This graphical budget primer is more accessible than some of our longer reports, and we're hopeful that it will make the federal budget easier to understand.

CBO's Budget Infographic

Today's infographic is the latest installment in our ongoing effort to present more budgetary information in a graphic form. This past summer we provided a set of easy-to-view slides on the outlook for the budget and economy. In addition, we published an infographic on Social Security, which provides historical statistics and projections of the program's financial status, the number of workers per beneficiary, the distribution of recipients, and the program's share of federal spending.

Jonathan Schwabish of CBO's Health and Human Resources Division and Courtney Griffith of CBO's communications team prepared today's infographic.

Posted via email from htlkirkland's posterous

CBO’s Estimate of the Cost of the TARP: $34 Billion

http://cboblog.cbo.gov/?p=3058

Today CBO released the latest in a series of statutory reports on transactions undertaken as part of the Troubled Asset Relief Program (TARP)—the program established in October 2008, during the financial crisis, to enable the Department of the Treasury to promote stability in financial markets through the purchase and guarantee of “troubled assets.”

To further our effort to demystify certain aspects of the federal budget, CBO also prepared an infographic on the TARP. Its aim is to summarize the most pertinent details about the TARP since its inception: the types of assistance, cash disbursements, and net budgetary costs or gains.

What is CBO’s current estimate?

CBO estimates that the net cost to the federal government of the TARP’s transactions, including the cost of grants for mortgage programs that have not been made yet, will amount to $34 billion. CBO’s analysis reflects transactions completed, outstanding, and anticipated as of November 15, 2011.

That cost stems largely from assistance to American International Group (AIG), aid to the automotive industry, and grant programs aimed at avoiding home foreclosures: CBO estimates a cost of $59 billion for providing those three types of assistance.

But not all of the TARP’s transactions will end up costing the government money. The program’s other transactions with financial institutions will, taken together, yield a net gain to the federal government of about $25 billion, in CBO’s estimation.


How does the estimate differ from our March 2011 estimate?

CBO’s current estimate of the cost of the TARP’s transactions is $15 billion higher than the $19 billion estimate shown in the agency’s previous report. That increase in the estimated cost stems primarily from a reduction in the market value of the government’s investments in AIG and General Motors.


How does the estimate compare with OMB’s estimate?

The Office of Management and Budget (OMB), in its latest estimate, projects the program’s costs to total $53 billion. CBO’s current estimate is less than OMB’s estimate, largely because CBO projects less spending for the Treasury’s housing programs under the TARP; that difference is partially offset by CBO’s higher estimate of the cost of assistance to AIG.

How does the cost compare with our original estimate?

CBO’s current estimate of the total disbursements by the TARP and the net cost of those disbursement is well below what was originally envisaged. Only $428 billion of the originally authorized $700 billion will be disbursed through the TARP, CBO estimates.

When the program was created, the U.S. financial system was in a precarious condition, and the transactions envisioned and ultimately undertaken engendered substantial financial risk for the federal government. Nevertheless, the costs directly associated with the TARP, when taken in isolation, have been toward the low end of the range of possible outcomes anticipated when the program was launched—in part because funds invested, loaned, or granted to participating institutions through the Federal Reserve and other government programs besides the TARP helped limit those costs.

This report was prepared by Avi Lerner of CBO’s Budget Analysis Division. The infographic was prepared by Jonathan Schwabish of CBO's Health and Human Resources Division and Courtney Griffith of CBO's communications team.

Posted via email from htlkirkland's posterous

Cost of Tax Cut: Another $17 a Month on Most Mortgages

http://www.cnbc.com/id/45708514

Who is paying for the two-month extension of the payroll tax cut working its way through Congress? The cost is being dropped in the laps of most people who buy homes or refinance beginning next year.

The typical person who buys a home or refinances starting on Jan. 1 would have to pay roughly $17 more a month for their mortgage, thanks to a fee increase included in the payroll tax cut bill that the Senate passed Saturday. The White House said the fee increases would be phased in gradually.

The legislation provides a two-month extension of a payroll tax cut and long-term unemployment benefits that would otherwise expire on Jan. 1. It would also delay for two months a cut in Medicare reimbursements for doctors that is scheduled to take effect on New Year's Day. The House is expected to act on the bill early next week. Two more months of the Social Security tax cut amounts to a savings of about $165 for a worker making $50,000 a year.

To cover its $33 billion price tag, the measure increases the fee that the government-backed mortgage giants, Fannie Mae and Freddie Mac, charge to insure home mortgages. That fee, which Senate aides said currently averages around 0.3 percentage point, would rise by 0.1 percentage point under the bill.

For the holder of a typical $200,000 mortgage, that means their monthly housing payment would be about $17 higher.

The 0.1 percentage point increase will also apply to people whose mortgages are backed by the Federal Housing Administration, which typically serves lower-income and first-time buyers.

The higher fee would not apply to people who currently have mortgages unless they refinance beginning next year.

Because of the weak housing market and the huge numbers of foreclosures in the last few years, private insurers have not competed strongly for business with Fannie Mae and Freddie Mac, which have the backing of the federal government. As a result, about 9 in 10 new home mortgages are backed by Fannie Mae, Freddie Mac and the FHA.

President Obama and many congressional Democrats and Republicans want to curb Fannie Mae's and Freddie Mac's dominance in the mortgage market. Obama earlier this year proposed raising the mortgage guarantee fees they charge as one way to do that.

Posted via email from htlkirkland's posterous

Thursday, December 8, 2011

Important Moments: Living History of Interest Rates, A Guaranteed Longshot

Interest Rates are declining today: a "perfect storm" for those looking to refinance, with the window of opportunity opening today. As I write this email, the interest rate on the 10 Year Treasury note is at 1.98%. While 30 year fixed mortgage rates don't move in 100% lockstep with 10 Year Treasuries, the correlation is extremely high; think of a tether linking the 30 Year Fixed Mortgage rate and the 10 Year Treasury Note.

I am writing this email while watching Jon Corzine testify in front of Congress. It's a very sad day for the former CEO of Goldman Sachs and the recent CEO of MF Global to say under oath that he doesn't know where the money went.

But this email is not about Jon Corzine's testimony, per se. It is about a "Perfect Storm" that appears to be unfolding that may, potentially, lead to slightly lower interest rates in the immediate near future.

The "Perfect Storm" is 1) the combination of the failure of the EU to come to a meaningful agreement, essentially buying more time because fundamentally the countries are having immense difficulty coming to an agreement to resolve their issues, and 2) a lack of liquidity in the financial futures markets that has resulted from the MF Global fiasco. Up until now, this lack of liquidity, since the October 31, 2011 bankruptcy of MF Global hasn't had a catastrophic impact on the financial markets. But with the potential severity of the EU situation combined with the reduced liquidity in the financial markets from the MF Global fiasco, we may be facing somewhat temporary, but very upsetting "Risk Off" trade, meaning money would be temporarily flowing on a major scale into US Treasuries, perceived to be a safe haven. With interest rates under 2% on the 10 Year Treasury, it seems that process has begun. The question is: will it continue, and if so, how far?

History of EU Summits

Hat Tip to Barry Ritholtz' The Big Picture Blog link

(click on link to see chart)

As we can see above, we've had many Euro Zone meetings in 2011 to address the European debt crisis. And the net effect of these meeting has been disappointment, and it appears that today's summit is going to be disappointing as well.

Now, as I write this email, we don't know the final announcement from European leaders. That will come out in the wash tomorrow. Maybe there will be a pleasant surprise for the markets to cheer.

If we get a "pleasant surprise" from the markets, the short term effect will be a relief rally in "Risk On" assets and a selloff in "Risk Off" assets. To simplify matters, "Risk On" assets are assets like stocks and commodities. "Risk Off" assets are U.S. Treasury Bonds and mortgage backed securities. In short, "Good News" means higher interest rates, "Bad news" means lower interest rates.

So if we get "bad news", implying lower interest rates, the big question is "how much lower can interest rates go?". The answer is, historically, not that much lower, but enough to make a difference in your refinance rate. It's critical that if you are looking to refinance right now, that you have someone watch the interest rate market like a hawk, with a finger on the lock trigger.

The History Of Interest Rates - A Guaranteed Longshot
Below is the graph, from the Federal Reserve Bank of St. Louis link, of the daily closing yield of the US 10 Year Treasury from January 1, 1962 to December 6, 2011.

As I write this email, the U.S. Treasury 10 Year yield is at 1.98%. To put this yield into historical context, I have downloaded all of the days in the above chart, a total of 13,026 days, from January 1, 1962 to December 6, 2011. Out of these 13,026 days, there has been a grand total of 19 days, all of them in 2011, with interest rates below 2%. Most people would look at a 19 out of 13,026 chance as being an incredible long shot, a long shot not even worth considering or thinking about because, well, let's face it a 19 out of 13,026 long probably is not going to happen. But in this case, today, if you are looking to refinance,  we have a guaranteed opportunity to lock in a 19 out of 13,026 long shot. It's literally here today.

Now putting together the historical opportunity presented above, there is also the practical matter of refinancing. If you do not have a loan application in the system, you need to begin the process. It only takes a few minutes of time on the phone. Once we get an automated approval, we can get the lock process started.

Can interest rates go lower?

I'm going to surprise some folks when I say this, but if the official EU announcement is perceived by the markets as disappointing, then the answer to this question in yes, it is possible that we may see interest rates going slightly lower than where they are at right now. But we also know that interest rates simply don't stay below 2% for very long. Some sort of crisis pushes the rates below 2% for a few days (think of a beach ball pushed below the water and then popping back up quickly) , and then the economic pressures causing the rates to go below 2% ease up, and rates pop back up. Historically, the lowest interest rate on the 10 Year Treasury in the Fed's database, from 1962 to today, was on September 22, 2011 at a rate of 1.72%. Here are all the interest rates below 2%, from 1962 to today.


Date

 Interest Rate

2011-09-22

2011-10-03

2011-10-04

2011-09-23

2011-09-21

2011-11-23

2011-09-26

2011-09-30

2011-10-05

2011-09-09

2011-09-12

2011-11-22

2011-09-20

2011-11-17

2011-09-19

2011-11-21

2011-11-25

2011-11-28

2011-09-06

2011-09-29


1.72

1.80

1.81

1.84

1.88

1.89

1.91

1.92

1.92

1.93

1.94

1.94

1.95

1.96

1.97

1.97

1.97

1.97

1.98

1.99


If you are considering refinancing your mortgage, I would say that this rare window of opportunity is now open. "Guaranteed" longshots rarely come along in life, and when they do, one needs to be prepared to take advantage of the opportunity that presents itself.

Note:this is the text version of an email sent to clients. I'm posting this via posterous, which does not allow me to include the graphs. For those that want the original email, I can be contacted at dan.mellis@htlkirkland.com


Posted via email from htlkirkland's posterous

Wednesday, October 26, 2011

Ask Captain Scott

Incredibly cool website: Ask Captain Scott http://askcaptainscott.com/

Scott is a commercial airline pilot and the website takes you into the cockpit of real planes.


Posted via email from htlkirkland's posterous

Wednesday, August 3, 2011

Interest Rates:10 Year Treasuries Plunging

Interest rate are dropping big time the last three days.


There are three obvious reasons:


1) Very weak GDP report last Friday, with an especially weak revision. For Q2-2011, GDP grew at an annual rate of 1.3%, and Q1-2011 GDP was revised down to 0.4% GDP growth. Link


2) A weaker ISM Manufacturing report on Monday. "The PMI registered a 50.9%, a decrease of 4.4 percentage points..." link ; followed by a tepid ISM non-manufacturing report today, link


3) Italy taking center stage in the ECB/EU slow motion trainwreck, with Prime Minister Berlusconi poised to put gasoline on the fire later today in a nationwide speech. link


There is a major forth item that is looming in the background: some form of QE3. If history is any guide and we see additional Quantitative Easing, we will see interest rates move higher.


The interest rate conditions right now look very attractive to lock in interest rates at these levels.


Current Interest Rates


Wednesday, July 27, 2011

Gold / Debt Limit Chart

Interesting chart correlating the price of gold with the raising of the debt limit ceiling.


Source: zerohedge


Wednesday, July 13, 2011

1995-1996 Govt Shutdown Impact on Interest Rates

Interestingly enough, interest rates declined during the 1995-1996 government shutdown. And, coincidentally or not, interest rates are declining now.


1995-96 Government Shutdown
SUMMARY:

From November 14 through November 19, 1995 and from December 16, 1995 to January 6, 1996 the U.S. government was shut down as a result of a budgetary impasse between Congress and the White House. The shutdown was precipitated by a dispute between Democratic President Bill Clinton and Republican Speaker of the House Newt Gingrich over domestic spending cuts in the fiscal year 1996 budget and resulted in a bipartisan agreement to balance the budget in seven years' time.
http://bancroft.berkeley.edu/ROHO/projects/debt/governmentshutdown.html

1995-1996: 10 Yr Treasury Note Rate
Crisis Began November 14, 1995: 5.97%
Crisis End January 6, 1996: 5.69%

Tuesday, July 5, 2011

Federal Debt Rollover in August: $467 Billion

Comments: August is going to be a very tumultuous month.

First, we have the debt ceiling issue to contend with. It's been estimated that X-Day (the date after which Treasury will not havesufficient cash to pay ALL of its bills) is going to be sometime between August 2 and August 9.

Next, if and when we get over the X-Day hurdle, there is the matter of $467 Billion of Treasury debt that will need to get financed in August. $467 Billion in one month, that is simply a staggering figure.

Interesting that interest rates spiked higher last week, just after this report was released privately.

Originally posted at Zerohedge: link

Debt Ceiling Analysis

Thursday, June 30, 2011

Delinquency Rates Falling

From Calculated Risk:

"Fannie Mae reported that the serious delinquency rate decreased to 4.14% in May, down from 4.19% in April. This is down from 5.15% in May 2010. The Fannie Mae serious delinquency rate peaked in February 2010 at 5.59%."


Interest Rates Moving Higher

Interest Rates are moving higher this morning, most likely in response to three items:

1) Chicago Purchasing Managers Index (PMI) surprising to the upside link

Index (SA): Jan '11: 68.8 Feb '11: 71.2 Mar '11: 70.6 Apr '11: 67.6 May '11: 56.6 Jun '11: 61.1

2) KC Fed Manufacturing Survey posted a rebound link

3) End of QE2

All in all, a terrible 4 days for interest rates as the Treasury's 10 Yr Bond index has jumped from a low of 2.84% last Friday to today's current yield of 3.15%, a 31 bps jump in yield.

Technically, the Rsi is still rising at 59.13. Based on the internal Rsi construction, we should expect interest rates to continue to rise, albeit I would expect more modestly moving forward, through the first half of July before we would look to re-assess the interest rate outlook on a technical basis.

Tuesday, June 21, 2011

Employment For Last Four Recoveries


Using the Household Survey of Total Civilian Employment.

Link: http://research.stlouisfed.org/fred2/series/CE16OV/downloaddata?cid=12

I've set the baseline as the official month of recovery established by the NBER. The most recent monthly data currently gives us 23 months since the recovery began. Here are the cumulative employment gains (losses) at the 23 month mark for the 1982 Recovery, the 1991 Recovery, the 2001 Recovery, and the 2009 Recovery, as reported by the BLS Household Survey:

1982 Recovery: 6,526,000
1991 Recovery: 1,623,000
2001 Recovery: 1,746,000
2009 Recovery: -199,000

Now, let's take this one small step further...we have the cumulative totals for the first 23 months above, but let's then look at the 24th month in isolation, and compare it with the most recent month's data for this recovery:

1982 Recovery 24th month: +334,000
1991 Recovery 24th month: +267,000
2001 Recovery 24th month: +440,000
2009 Recovery 23rd month (latest data): +105,000

Tuesday, June 14, 2011

Technical Snapshot: 10 Yr Treasury Index


A very brief technical snapshot of the 10 yr Treasury index.

Technical Picture: 10 Yr Treasury Index

Comments: June 9, 2011 low in interest rates was accompanied by a momentum divergence in the rsi (higher momentum low with lower price low) indicating at least a short term bottoming pattern in interest rates. Assuming that the market is now in a counter-trend rally from the April 8 short term high in interest rates…200 day Moving Average at 3.10%...50 day Moving Average at 3.23%...basically looking for a very modest increase in rates through the end of June, with the obvious targets in the 3.23% range.

Profile of March 16 to April 8 increase in interest rates
Low in rate: 3.14%
High in rate: 3.62%
Increase of 48 bps
Total number of trading days: 17

Current Profile:
Low in rate: 2.91%
Date of low in rate: June 9, 2011
17 days from June 9: July 5

Thursday, May 26, 2011

Q1 GDP Revision; Jobless Claims

From the BEA: Gross Domestic Product, First Quarter 2011 (second estimate)
Today's GDP Revision came in at an unchanged 1.8% annualized rate.

Initial jobless claims moved higher to 424,000. Link here.

Tuesday, May 3, 2011

Comparison of Last Four Economic Recoveries

I've put together a comparison, on a cumulative basis in percentage terms, of the last four economic recoveries.
Raw Percentage Numbers from Excel Spreadsheet:


Currently, the 2009 recovery is doing slightly better than the 2002 recovery, although the difference is more than entirely due to the inventory rebuild experienced in the current recovery.

Cumulative Inventory Gains 2009 Recovery vs 2002 Recovery, as a cumulative percentage to GDP, after 7 quarters:
2002: 3.51%
2009: 6.51%

Comparison of Economic Recoveries - Chart

Tuesday, April 19, 2011

When Will Fed-Created Melt-Up Turn Into a Meltdown?

A thought provoking article by Russ Winter at Minyanville.


link
The following chart says it all. The Fed’s aggressive Treasury monetization has been the causa proxima (90-percent correlation) to the peddle-to-the-metal Minsky Meltup in commodities. I suspected this would be the effect but confess I did not believe the Fed and government could be so irrational as to attempt it, especially with the blowback evident by year end. Though I am one of the most persistent critics of the Fed, this exceeded even my worst fears. This is what Bernanke refers to as “temporary” inflation. Nor did I anticipate the markets ignoring such clear and present danger. The transmission of this inflation disease appears to take about six months, which corresponds to the MIT price survey I have been using. It, too, now shows that inflation is in full swing.

The question now: When does the meltup switch into a full-fledged meltdown of the global economy? In spite of all warning signs that the Fed has ignored over the past few months, the switchover is now transmitting at such a rapid pace that it could happen in either one great shock or in a series. In my view, the 320 level on the CRB was more than enough to trigger the switch, and it corresponds with the first riots in Tunisia and then Egypt. If the Fed continues its purchases, we can calculate that each new $100 billion of Treasury purchased will add about 5 percent to the commodity index and $7 to oil. It takes four weeks for the Fed to purchase $100 billion in Treasuries. What a game of chicken being played out and right before our eyes! You can sense the collision, flying glass, blood, and bones at almost any moment. If the Fed desists or scales down its Treasury buying, the stark trillion dollar question becomes who will buy them?

Monday, March 28, 2011

The 2009 Stimulus Package: Two Years Later

From Professor John B. Taylor... I would highly recommend visiting Prof. Taylor's blog here.
The 2009 Stimulus Package: Two Years Later

Testimony Before the Committee on Oversight and Government Reform Subcommittee on Regulatory Affairs, Stimulus Oversight and Government Spending U.S. House of Representatives February 16, 2011


Conclusion

In sum, the data presented here indicate that the American Recovery and Reinvestment Act was not effective in stimulating the economy. Despite its large size, ARRA did not result in more than an immaterial increase in government infrastructure and other purchases at the federal level. The large grants to the states did not result in an increase in government infrastructure and other purchases at the state and local level. And finally an analysis of the payments that temporarily increased disposable income shows that they did not significantly affect personal consumption expenditures. In contrast changes in private investment and net exports have been much more of a factor in the recovery. Currently, the increased debt caused by ARRA—both directly through its deficit financing and indirectly through its de-emphasis on controlling spending—is likely a drag on economic growth.


http://media.hoover.org/sites/default/files/documents/2009-Stimulus-two-years-later.pdf

Wednesday, March 23, 2011

Daily Mortgage Rate Review

Chart - 30 Yr Fannie Mae
Daily Chart - 6 month
Today's Close: 98.81 - 3 bps

Mortgage Rates, closest to par pricing:
30 Yr Fixed: 4.75%
15 Yr Fixed: 4.25%
5/1 ARM: 3.125%

Thursday, March 10, 2011

Big Changes Coming To Mortgage Originators April 1, 2011

There are going to be big changes coming to the mortgage industry on April 1, with a complete restructuring of how fees will be charged, interest rate options for the consumer...

I was in a 1 hour webinar this afternoon with my company regarding our restructured compensation plan, and to be honest, it was the most confusing hour I've spent in a long time. As things get clarified in the next three weeks, I will update the situation accordingly.

CBO Reducing the Deficit: Spending and Revenue Options

CBO
Reducing the Deficit: Spending and Revenue Options
Link

Abstract
The Congressional Budget Office (CBO) regularly issues a compendium of budget options to help inform federal lawmakers about the implications of possible policy choices. This volume—one of several reports that CBO produces regularly for the House and Senate Committees on the Budget—presents more than 100 options for altering federal spending and revenues. Nearly all of the options would reduce federal budget deficits. The report begins with an introductory chapter that describes the current budgetary picture and the uses and limitations of this volume. Chapters 2 and 3 present options that would reduce mandatory and discretionary spending, respectively.
Chapter 4 contains options that would increase revenues from various kinds of
taxes and fees.

Summary
Federal budget deficits will total $7 trillion over the next decade if current laws remain unchanged, the Congressional Budget Office (CBO) projects. If certain policies that are scheduled to expire under current law are extended instead, deficits may be much larger. Beyond the coming decade, the aging of the U.S. population and rising health care costs will put increasing pressure on the budget. If federal debt continues to expand faster than the economy—as it has since 2007—the growth of people's income will slow, the share of federal spending devoted to paying interest on the debt will rise, and the risk of a fiscal crisis will increase.


Options for Reducing Mandatory Spending

Of the 32 options in the mandatory spending chapter:
- Fifteen deal with spending for health care programs.
- Seven would make changes to Social Security or other retirement programs.
- Ten focus on Fannie Mae, Freddie Mac, and programs that deal with education, energy, or agriculture.

Summary Link

Comments: I will have the tax summaries up from Chapter 4 for all 36 Taxing Proposals tommorow.

Saturday, February 19, 2011

CNBC Strategy Session Interview With Kyle Bass

Here are the transcripts from the Strategy Session interview with Kyle Bass on Wednesday, February 16, 2011.

Part 1 - Sayonara Japan


CNBC – Strategy Session
Guest: Kyle Bass – Part 1
Hosts: David Faber, Gary Kaminsky
Link

Part 1: Sayonara Japan

David Faber (2:45): Japan’s swoons, global defaults, the end of the world…If these are things that have you worried as an investor, well, you couldn’t have picked a better show to tune in to. That’s because our special guest today, Kyle Bass, Managing Partner at Hayman. It’s a hedge fund whose strategy involves, in part, occasionally, betting on so-called tail risks. You know, for Kyle, the unthinkable economic disaster is, of course, something that is quite thinkable. And something that he writes quite cogently about; it’s a strategy that worked quite well during the bursting of the housing bubble. And he is back in a Strategy Session exclusive. Always nice to have you.

Kyle Bass (3:18): Nice to see you again.

David Faber (3:19): Let’s start off on Japan if we can. We’ve talked to you about it before, and um, and you know my question is always, okay, when? You know, what ultimately brings the tell, if you will, that things are really starting to happen in Japan the way you expect them to?

Kyle Bass (3:33): Yeah, so, you prefaced your remarks with “the end of the world”, none of this is the end of the world, right. What we’re talking about is a restructuring that I think has to happen for the world to grow again. So, when you ask about doom and gloom, and talking about the end of the world, it’s not. Basically people lose money and you just don’t want to be one of the people that loses money when it happens. So, maybe you might want to make some money on the way down.

David Faber (3:57): It could involve a worldwide decline in living standards, could it not?

Kyle Bass (4:02): Yeah, it could have a worldwide decline in GDP. But, you know, it’s the way this works. So far, what we’ve seen, is total credit market debt in the world, in the last 10 years, has gone from $80 Trillion to $200 Trillion. Right, that’s an 11% growth rate in credit market debt globally, while GDP has grown at 4%.

David Faber (4:21): That’s the basic underpinning to a lot of your thesis at the end of the day, is it not?

Kyle Bass (4:24): Yeah, in the end, I guess, the question you have to ask yourself is: Does debt matter? If it doesn’t matter, then we’re in a cyclical upswing and everything’s going to be fine.

David Faber (4:31): Well, let’s start off with Japan. You know, Gary was, we were looking at the Nikkei there, you’ve been focused on it for some time. And again, the basic thesis there is simply, these guys have way too much debt, and ultimately are going to reach some Keynesian endpoint, as you like to say, where they can’t even service the interest on the debt.

Kyle Bass (4:47): Correct. So, when you look at the, it’s a math problem, and my assertion is that there is a fundamental availability of debt in each host country’s system. And we believe that Japan has sailed into the zone of insolvency many years ago, and that their only hope going forward is this kind of path of homeostasis that they’ve enjoyed for the last 10 years.

What sets this off? Well, there are a number of things that can set this off. It’s just a loss of confidence, right.

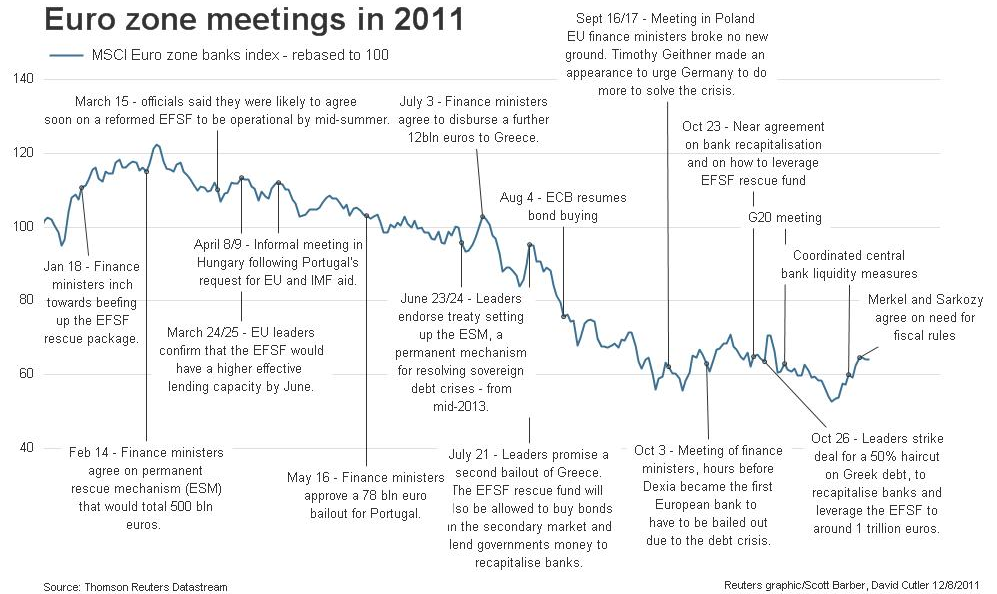
You have, if you look at Greece, Greece didn’t have a maturity default, Greece didn’t have a failed bond auction, you woke up one day and the rates went up. You woke up the next day and they went up a little more. And by the time you decided to pay some attention to Greece it was too late, their short rates were in the twenties.

In Japan, you had 20 years of pro-cyclical thought, working, that literally has built on itself and manifested itself into this scenario in which…who buys a 10 year, 1% bond?

David Faber (5:38): A lot of Japanese people did.

Kyle Bass (5:39): Right, right, but they expect persistent deflation, right. The whole argument over there is that they buy 1% nominal yield, they have 2 or 3% deflation, and they get 3 or 4% real yields, right, nominal yields plus deflation. Well, look at the world today, you’re starting to see, you know, inflation prints. Whether it’s food and energy, or ex-food and energy, around the globe, you’ve seen many of these prints recently in China and in India and the different places, everyone’s starting to feel some inflation.

Yes, U.S. housing isn’t moving yet, and that’s what, the Fed, I believe, is focused on. But, as you start to see inflation, and people need positive real yields, you’ll have moves in interest rates that will cause these collapses. And I just…you know, you’re asking me when, and, this is a 75 year secular cycle. You’re asking me to choose a day, a month, a year. I don’t know. The answer’s in the next few years. I can’t see how they can avoid it.

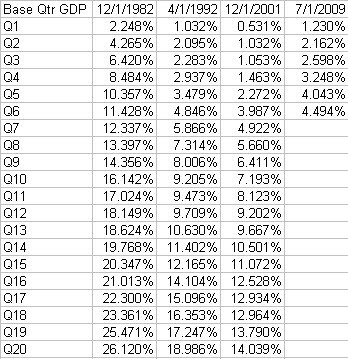
David Faber (6:29): What’s going to be the “tell”, I guess. What’s, if there’s something that I can at least be focused on as an investor. When I’m looking at those charts that Gary showed me, for example, something that will be the “tell” if you will, that your scenario is starting to play out?

Kyle Bass (6:41): Just watch 5 and 10 Year cash JGB rates. That’s all you have to watch.

Gary Kaminsky (6:46): You know Kyle, let’s go back to the U.S. for a second. I showed a chart of what’s happening with the S&P since August, you saw that chart, in terms of don’t fight the fed here, quantitative easing. Um, and then we took a look at what happened in Japan. Are you surprised at how the equity markets, the U.S. equity markets, since we visited with you in the early fall down in Texas, have been so resilient to all of the potential concerns. You turn on the national news last night, all about the deficit here, all about the problems with the budget, yet the U.S. equity markets don’t seem to care about the ballooning debt right now. Is that something that surprises you?

Kyle Bass (7:20): It’s not. And here’s why. What’s one of the top performing stock markets globally in the last decade? It’s Zimbabwe. In nominal terms, if you owned Zimbabwe in stocks you’ve done really well, but you’ve lost all your money. So, the fact that, the, the…

David Faber (7:33): But, we don’t have 2000% inflation.

Kyle Bass (7:36): No, I agree. The point I’m trying to make is that Bernanke is printing $2.3 million dollars a minute, he’s printing $3.3 billion dollars a day, right now. Okay. So, if you print, I guess you have to think of this more holistically, and I don’t know if we have enough time, we’ll walk through it quickly.

If you have a system, a banking system, that had a ($1) Trillion of equity, and ($15) Fifteen Trillion of assets, and you had a $1.8 Trillion of M1, and then you, the banking system lost 10%, right, we lost about a trillion-four, a trillion-five in the banking system. If you print enough money to re-capitalize that, in theory, the tree fell in the woods and did anybody hear it? All we did was replace what was lost.

David Faber (8:08): Yeah, but we’ve taken ultimately what was debt on the private balance sheet and put it on the public balance sheet.

Kyle Bass (8:12): All we’ve done is moved the systemic risk, Gary. We’ve moved it from the private balance sheet, and we’ve moved it, so now the real systemic risk in the world sits on the public balance sheet.

Gary Kaminsky (8:19): If I’m a retail investor, and I buy into this, and I say, I have to own stocks because I want to get the increase in the value of the equities, but I have to sell them correct. I have to get out of them at the right time. What are your other options? I mean, if you just, in that scenario, as we keep printing money, is holding cash, and just holding that cash, is that a viable strategy in an economy that continues to print money and try to grow through deficit funding?

Kyle Bass (8:44): Uh, I mean look, I don’t want to advise retail investors from that perspective…

David Faber (8:48): But there are people that who are, perhaps, who are going to agree with your viewpoint, and I am wondering…

Gary Kaminsky (8:53): Oh, we get the emails, we get emails in here everyday. We get people saying, I agree with what Kyle says…

David Faber (8:59): Right. What can I do though? What’s? Own gold? What can I do? What would you advise people to do?

Kyle Bass (9:03): So…I think in the meantime you have to earn some money, because this may take a few years to play out. So, in the meantime, you need to own productive assets. And, you see the productive assets like the MLPs and the apartments, anything with a yield that is a productive asset with a yield.

Gary Kaminsky (9:17): So, what distributions are being generated and being returned to shareholders in a form of a dividend distribution…

Kyle Bass (9:23): Even non-productive assets like gold, silver, platinum, and palladium have gone up far in excess of what the stock market has from the bottom. If say, if you use them collectively. So, you need to be balanced. You need to have some money in cash, some money in real estate, you need to have some money in productive assets…But, if this ever plays out, let’s assume that you say Kyle’s just this guy from Texas, that has a 1% chance of being right, 99% of the time he’s probably going to be wrong. So let’s file this under Plan B. What Plan B is, to the extent that I’m right, and you start to see sovereign dominos falling and the focus ends up on Japan very quickly, what do you do with your money? Well, if we go from plus 4 GDP to minus 3 or 4 on GDP, and we have an equity market contraction of 40 or 50%, you’re going to need some money to buy. That’s going to be the greatest time in the world to buy, once these restructurings happen.

Gary Kaminsky(10:11): Guess what, I don’t think there are a lot of people out there that think there’s only a 1% probability that he’s right…

David Faber (10:14): No, and obviously he doesn’t think he’s got a 1% probability of being right. Where would you put your probability?

Kyle Bass (10:21): I think it’s a little higher than that.

David Faber (10:22): Umm, you know what, you wrote a great shareholder letter which we want to get a bit more. Explain the Zero Lower Bound. We’re going to have a lot more with Kyle Bass when we get back.
End of Part 1.

Thursday, January 27, 2011

CBO Budget Deficit Projections

For the latest CBO Budget Deficit Projection: link

Tax Revenue Growth Projections From CBO
2011: 3.09%
2012: 14.65%
2013: 20.95%
2014: 11.39%

Deficit Projections from CBO using above Tax Revenue Growth Projections
2011: $1.480 Trillion
2012: $1.100 Trillion
2013: $704 Billion
2014: $533 Billion

Those tax revenue growth projections look pretty high to me, so what happens if we scale back those projections. Rather than 14.65%, 20.95%, and 11.39% growth in 2012 - 2014, we are looking at rates of 5.45% growth (2012), 6.38% growth (2013) and 8.00% growth (2014).

Then, we're looking at deficits like this:
2011: $1.480 Trillion
2012: $1.305 Trillion
2013: $1.294 Trillion
2014: $1.275 Trillion

From the CBO Director's blog, link :
To prevent debt from becoming unsupportable, the Congress will have to substantially restrain the growth of spending, raise revenues significantly above their historical share of GDP, or pursue some combination of those two approaches. The longer the necessary adjustments are delayed, the greater will be the negative consequences of the mounting debt, the more uncertain individuals and businesses will be about future government policies, and the more drastic the ultimate policy changes will need to be. But changes of the magnitude that will ultimately be required could be disruptive. Therefore, Congress may wish to implement them gradually so as to avoid a sudden negative impact on the economy, particularly as it recovers from the severe recession, and so as to give families, businesses, and state and local governments time to plan and adjust. Allowing for such gradual implementation would mean that remedying the nation’s fiscal imbalance would take longer and therefore that major policy changes would need to be enacted soon to limit the further increase in federal debt.

Tuesday, January 4, 2011

Florida Attorney General Fraudclosure Report

I originally found this at zerohedge: http://www.zerohedge.com/article/florida-attorney-general-fraudclosure-report

Florida Attorney General Fraudclosure Report | Unfair, Deceptive and Unconscionable Acts in Foreclosure Cases