Comments: August is going to be a very tumultuous month.
First, we have the debt ceiling issue to contend with. It's been estimated that X-Day (the date after which Treasury will not havesufficient cash to pay ALL of its bills) is going to be sometime between August 2 and August 9.
Next, if and when we get over the X-Day hurdle, there is the matter of $467 Billion of Treasury debt that will need to get financed in August. $467 Billion in one month, that is simply a staggering figure.
Interesting that interest rates spiked higher last week, just after this report was released privately.
Originally posted at Zerohedge: link
Debt Ceiling Analysis
Tuesday, July 5, 2011


Thursday, June 30, 2011
Delinquency Rates Falling
From Calculated Risk:
"Fannie Mae reported that the serious delinquency rate decreased to 4.14% in May, down from 4.19% in April. This is down from 5.15% in May 2010. The Fannie Mae serious delinquency rate peaked in February 2010 at 5.59%."

Interest Rates Moving Higher
Interest Rates are moving higher this morning, most likely in response to three items:
1) Chicago Purchasing Managers Index (PMI) surprising to the upside link
Index (SA): Jan '11: 68.8 Feb '11: 71.2 Mar '11: 70.6 Apr '11: 67.6 May '11: 56.6 Jun '11: 61.1
2) KC Fed Manufacturing Survey posted a rebound link
3) End of QE2
All in all, a terrible 4 days for interest rates as the Treasury's 10 Yr Bond index has jumped from a low of 2.84% last Friday to today's current yield of 3.15%, a 31 bps jump in yield.
Technically, the Rsi is still rising at 59.13. Based on the internal Rsi construction, we should expect interest rates to continue to rise, albeit I would expect more modestly moving forward, through the first half of July before we would look to re-assess the interest rate outlook on a technical basis.

1) Chicago Purchasing Managers Index (PMI) surprising to the upside link
Index (SA): Jan '11: 68.8 Feb '11: 71.2 Mar '11: 70.6 Apr '11: 67.6 May '11: 56.6 Jun '11: 61.1
2) KC Fed Manufacturing Survey posted a rebound link
3) End of QE2
All in all, a terrible 4 days for interest rates as the Treasury's 10 Yr Bond index has jumped from a low of 2.84% last Friday to today's current yield of 3.15%, a 31 bps jump in yield.
Technically, the Rsi is still rising at 59.13. Based on the internal Rsi construction, we should expect interest rates to continue to rise, albeit I would expect more modestly moving forward, through the first half of July before we would look to re-assess the interest rate outlook on a technical basis.

Tuesday, June 21, 2011
Employment For Last Four Recoveries

Using the Household Survey of Total Civilian Employment.
Link: http://research.stlouisfed.org/fred2/series/CE16OV/downloaddata?cid=12
I've set the baseline as the official month of recovery established by the NBER. The most recent monthly data currently gives us 23 months since the recovery began. Here are the cumulative employment gains (losses) at the 23 month mark for the 1982 Recovery, the 1991 Recovery, the 2001 Recovery, and the 2009 Recovery, as reported by the BLS Household Survey:
1982 Recovery: 6,526,000
1991 Recovery: 1,623,000
2001 Recovery: 1,746,000
2009 Recovery: -199,000
Now, let's take this one small step further...we have the cumulative totals for the first 23 months above, but let's then look at the 24th month in isolation, and compare it with the most recent month's data for this recovery:
1982 Recovery 24th month: +334,000
1991 Recovery 24th month: +267,000
2001 Recovery 24th month: +440,000
2009 Recovery 23rd month (latest data): +105,000
Tuesday, June 14, 2011
Technical Snapshot: 10 Yr Treasury Index

A very brief technical snapshot of the 10 yr Treasury index.
Technical Picture: 10 Yr Treasury Index
Comments: June 9, 2011 low in interest rates was accompanied by a momentum divergence in the rsi (higher momentum low with lower price low) indicating at least a short term bottoming pattern in interest rates. Assuming that the market is now in a counter-trend rally from the April 8 short term high in interest rates…200 day Moving Average at 3.10%...50 day Moving Average at 3.23%...basically looking for a very modest increase in rates through the end of June, with the obvious targets in the 3.23% range.
Profile of March 16 to April 8 increase in interest rates
Low in rate: 3.14%
High in rate: 3.62%
Increase of 48 bps
Total number of trading days: 17
Current Profile:
Low in rate: 2.91%
Date of low in rate: June 9, 2011
17 days from June 9: July 5
Thursday, May 26, 2011
Q1 GDP Revision; Jobless Claims
From the BEA: Gross Domestic Product, First Quarter 2011 (second estimate)
Today's GDP Revision came in at an unchanged 1.8% annualized rate.
Initial jobless claims moved higher to 424,000. Link here.
Today's GDP Revision came in at an unchanged 1.8% annualized rate.
Initial jobless claims moved higher to 424,000. Link here.
Tuesday, May 3, 2011
Comparison of Last Four Economic Recoveries
I've put together a comparison, on a cumulative basis in percentage terms, of the last four economic recoveries.

Raw Percentage Numbers from Excel Spreadsheet:
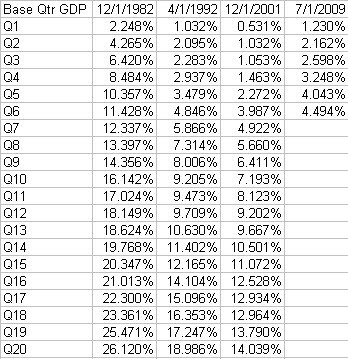
Currently, the 2009 recovery is doing slightly better than the 2002 recovery, although the difference is more than entirely due to the inventory rebuild experienced in the current recovery.
Cumulative Inventory Gains 2009 Recovery vs 2002 Recovery, as a cumulative percentage to GDP, after 7 quarters:
2002: 3.51%
2009: 6.51%
2002: 3.51%
2009: 6.51%
Comparison of Economic Recoveries - Chart

Subscribe to:
Posts (Atom)

